n8n Chatbot Analytics: Track Usage, Sessions, and Performance
Stop guessing how your n8n chatbot is performing. Here's how to get real visibility into what's actually happening, all from one dashboard.
Manoj Kumar
You've built an n8n chatbot, connected it to a webhook, and embedded a chat widget on your website, whether it's WordPress, a static site, or something else. But once it's live, a whole set of questions naturally follow.
How many messages is it handling per day? Are users having full conversations or dropping off after one message? Which devices and browsers are they on? Where in the world is the traffic coming from?
- Real-time message volume with hourly, daily, and custom ranges.
- Session counts and average messages per conversation.
- Device, browser, and geographic breakdowns of your traffic.
- Error tracking that surfaces failed n8n workflow calls.
Knowing the answers helps you understand whether your chatbot is working for your users and where to focus your attention next.
With Managed widgets on n8nchatui.com, you don't need a separate analytics tool to get this data. It's all built into the same dashboard where you build and manage your widgets. No third-party integrations, no custom logging in your n8n workflow, no extra setup.
What You Can Track
Managed widgets come with a dedicated analytics dashboard that gives you a full picture of how your chatbot is being used. Here's what's available.
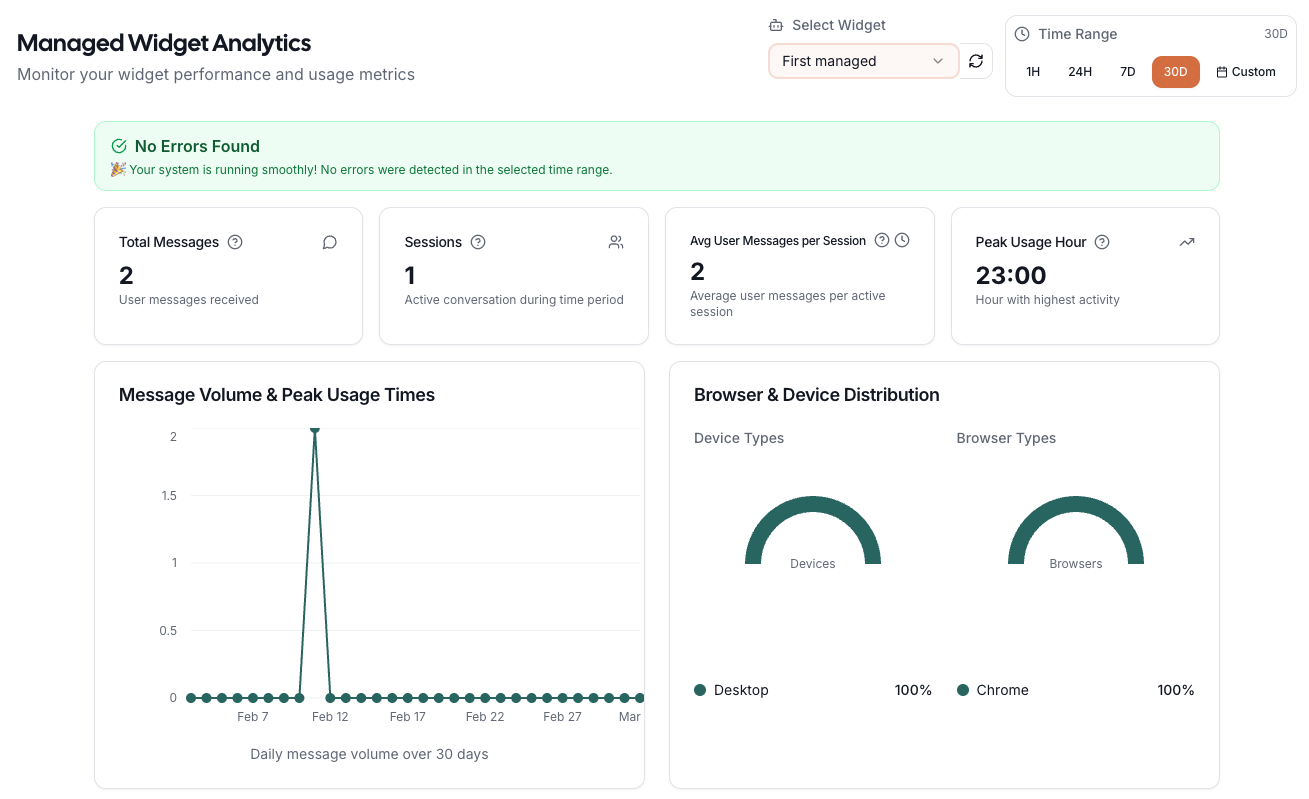
1. Message Volume
See exactly how many messages your chatbot has received over any time period. Filter by the last hour, 24 hours, 7 days, 30 days, or a custom date range. The chart adapts to your selected range, making it easy to spot usage patterns, catch traffic spikes early, and understand how adoption is trending over time.
2. Sessions
Every conversation is tracked as a session. You'll see the total number of unique sessions in your selected time period, plus the average number of user messages per session.
This tells you whether users are having quick one-off interactions or longer, multi-turn conversations. A high average might mean users are deeply engaged. A low average could mean they're finding answers fast, or that something is cutting the conversation short.
3. Peak Usage Hour
See which hour of the day sees the highest activity for your chatbot. This is useful for understanding when your users are most active so you can make informed decisions around rate limits, scheduled maintenance windows, or time-sensitive chatbot behavior.
4. Browser and Device Distribution
Know exactly what your users are using to interact with your chatbot. The dashboard breaks down traffic by device type and browser, so you can prioritize your design and testing efforts where they'll have the most impact.
5. Global Message Traffic
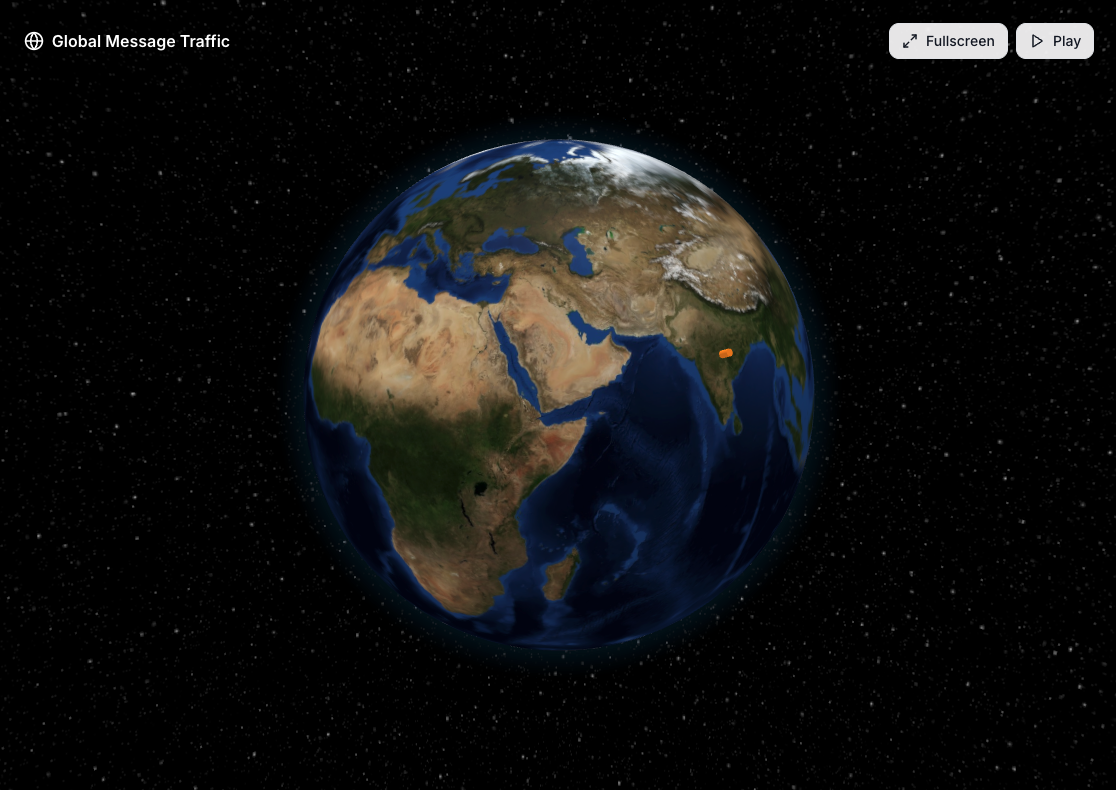
The Global Message Traffic globe gives you an interactive, visual view of where in the world your chatbot messages are coming from. Each country with traffic appears as a point on the globe, sized by message volume.
This is particularly useful if you serve users across multiple regions, run geofencing restrictions, or want to understand the geographic reach of your chatbot.
6. Error Tracking
Beyond usage data, the dashboard also tracks errors from your chatbot interactions. If your n8n webhook returns unexpected responses, the analytics dashboard captures the details and surfaces them clearly.
The exact response your n8n workflow returned, so you know what to fix.
How many times each error has happened, so you can prioritize what's most common.
When the error last occurred, so you know if it's still happening or already resolved.
The dashboard hints at likely causes for common n8n-related errors.
The analytics dashboard doubles as a debugging tool. Errors your users hit show up here before you have to hear about them.
One Dashboard for All Your Widgets
If you manage multiple chatbots across different websites or clients, all of their analytics live in one place. You can switch between any of your managed widgets from a single dropdown and instantly see the data for that widget. No jumping between tools, no separate logins, no context switching.
Choose from preset time ranges or define a custom date range, and refresh the data on demand. All metrics and charts update instantly when you make a change.
Getting Started
If you're already using a Standalone widget on n8nchatui.com and want analytics, you can convert it to a Managed widget directly from the dashboard. Your design and customization settings carry over. You'll just need to update the embed code on your site.
If you're starting fresh, follow our step-by-step guide to creating a custom n8n chat widget and select Managed as the widget type during setup.
Once your managed widget is live and receiving messages, the analytics dashboard will start populating automatically.
To improve how replies feel to users (word-by-word streaming from your n8n AI workflow), pair analytics with our n8n chat streaming guide.
Wrapping Up
Building an n8n chatbot is just the beginning. Understanding how it performs, who's using it, and where it might need improvement is what helps you make it better over time.
With n8nchatui.com's Managed widgets, all of that is available in one place: message volume, sessions, peak usage hours, device and browser breakdowns, geographic traffic, and error tracking, all built in alongside the widget builder itself.
See what your chatbot is actually doing.
Message volume, sessions, devices, geographic reach, and error tracking. All built into the widget you already ship.
More Articles
Create a Custom n8n Chat Widget (No Code)
A step-by-step guide to creating a fully customizable chat widget that connects to your n8n workflows and embed it on any website. No coding required.
March 4, 2026
Standalone vs. Managed Chat Widgets for n8n
A clear breakdown of the two widget modes available on n8nchatui.com: how they differ, what each one offers, and which one fits your use case.
March 4, 2026
How to Add a Free Chat Widget to WordPress (No Plugin)
Embed a free, AI-powered chat widget on any WordPress site in minutes with no plugin and no code. Connect it to n8n and customize every detail.
March 10, 2026
n8n Chat Streaming: A Complete Setup Guide
Turn slow, wait-and-see AI chatbot responses into a real-time streaming experience. Learn how to set up chat streaming in n8n and connect it to a chat widget on your website.
April 2, 2026